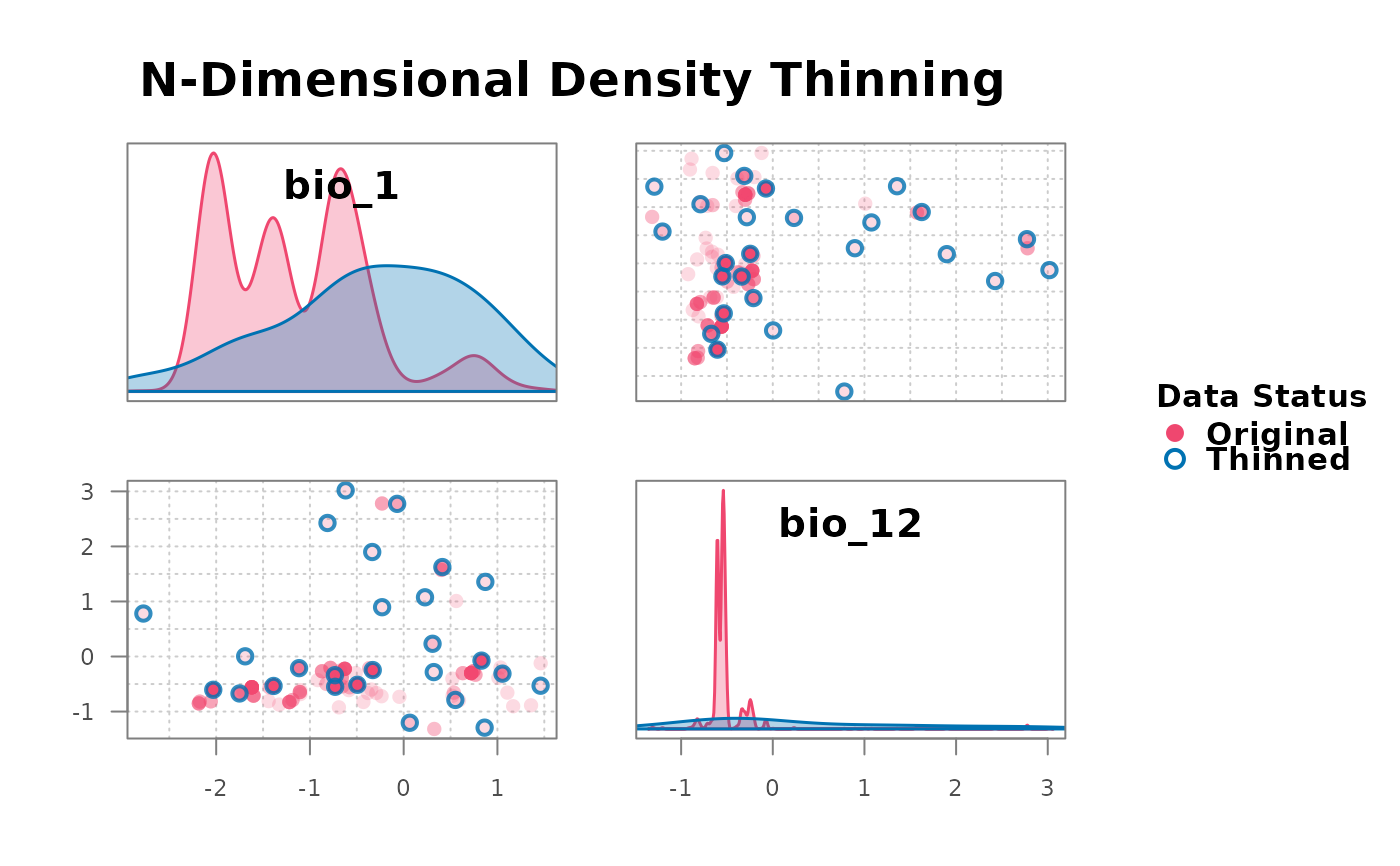
This function creates a scatterplot matrix (pairs plot) to visualize the results of n-dimensional environmental thinning using base R graphics. It can accept thinned objects from either density-based thinning (`thin_env_nd`) or deterministic centroid thinning (`thin_env_center`).
Examples
data(origin_dat_prepared, package = "bean")
env_vars <- c("bio_1", "bio_12")
thinned <- thin_env_nd(
  data            = origin_dat_prepared,
  env_vars        = env_vars,
  grid_resolution = c(0.5, 0.5),
  seed            = 1
)
plot_bean(origin_dat_prepared, thinned, env_vars = env_vars)